Georgia Tech PhD candidate Andy Quitmeyer came up with another way of representing the affordance gird described in Chapter 3 of Inventing the Medium, using the framework of a radar chart. Here is his example, and the downloadable vector file is here.
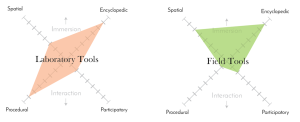
Example of Affordance Grid as a radar chart, with thanks to Andy Quitmeyer.


