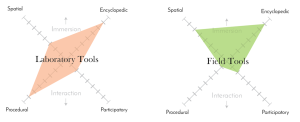
For an area of interest – perhaps one that you are thinking of as the focus for a larger project — place at least 3 existing digital artifacts on the grid diagram according to their use of the digital affordances described in chapters 2 and 3 of ITM. What affordances or combinations of affordances have been under-exploited
For example, if skateboarding is your focus, you might put a Google map of local skateboard stores in the Spatial quadrant and a skateboarding blog and a skateboarding Twitter feed in the Participatory quadrant. You might then see missed opportunities, such as an encyclopedic archive of skateboard designs or an interactive model of a skateboard park or an augmented reality overlay of skateboarding tricks visible in a particular park.